Case study · Build · 2026
NetTracer
A network lab in the browser. Packets cross a 3D network one frame at a time, and each hop shows which header fields changed.
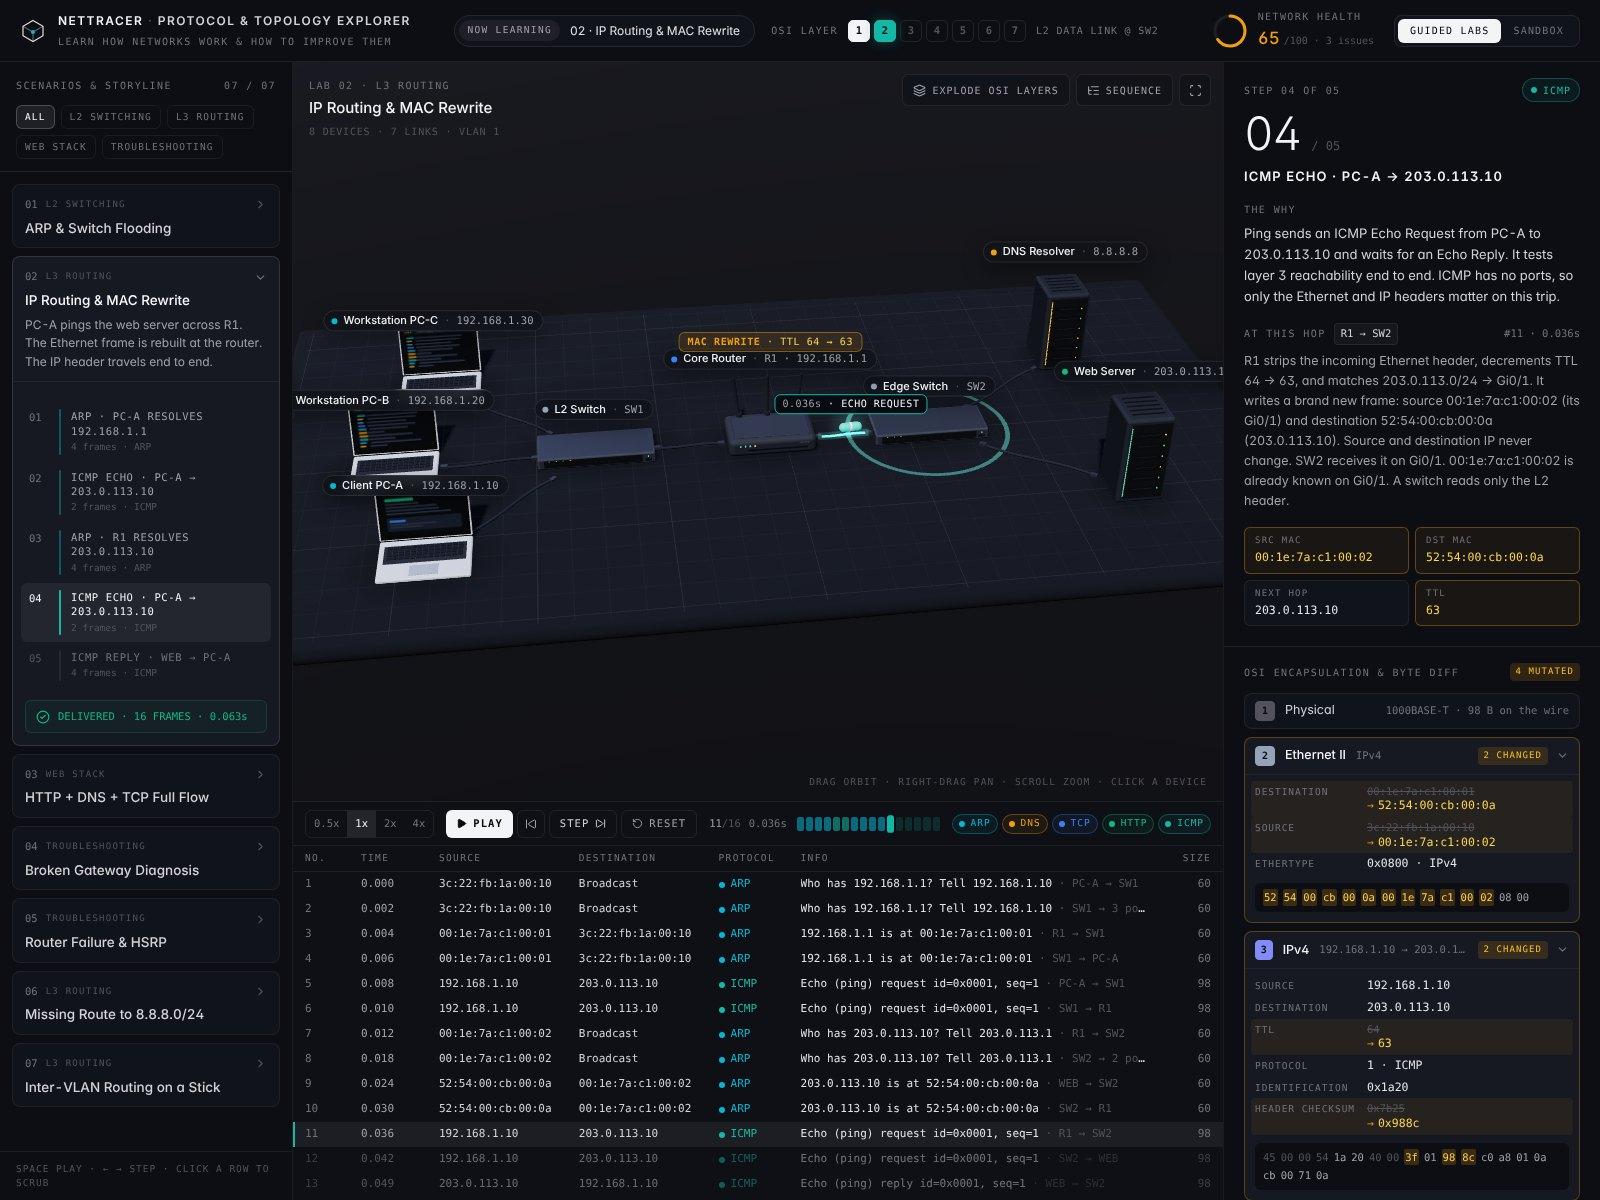
NetTracer is a network lab in the browser. It follows one packet across a 3D network a frame at a time and shows which header fields change at each hop. It is built with React, Three.js, Tailwind CSS and Vite, and its 7 guided labs and sandbox are live with the code public.
- What it doesSee the developer side
A 3D network lab that walks packets hop by hop and shows which header fields change at each device.
The short version
- 01
The idea
Follow one packet across a network and see how the network works. Every frame is on screen, along with the header fields that change at each hop.
- 02
What I did
Built an engine that turns a network and a traffic flow into a packet capture, then set it under a 3D scene with 7 guided labs and a sandbox.
- 03
Where it stands
Live, with the code public. It has no tests yet, and the header checksum it shows is a stand-in.
What it does
Seven guided labs and a sandbox run on one engine.
Guided labs
Seven labs, each with a storyline of steps. Three of them start broken, and the capture shows where the packet dies.
3D stage
Laptops, switches, a router and rack servers on a floor grid. Packets travel the cables as capsules.
Capture table
Every frame in order, with its time, source, destination, protocol and size. Click a row to jump to it.
Step narrative
Each step says why the packet exists and what the device at this hop did with it.
Byte diff
The headers at each layer. A field that changed at this hop shows its old value struck through beside the new one.
Explode OSI Layers
Splits a packet on the stage into its L2, L3, L4 and L7 slabs.
One-click fixes
VLANs, gateway repair, HSRP, TLS and route restore. Each fix re-runs the simulation, so the capture shows what it changed.
Sandbox
Add laptops and servers, then click any device to edit its IP, mask, gateway, VLAN, uplink or power. A traffic generator runs a new capture from the host you pick.
The questions
Each lab answers one question.
How does a frame reach a MAC address nobody has learned yet?
What changes when a packet crosses a router?
What has to happen before a web page loads?
Why can’t PC-A open any website?
What happens when the only router loses power?
Where does a packet go when its route is missing?
How do two VLANs talk over one cable?
How it works
The engine is pure functions, so every edit re-runs the capture.
- 01
Network and flow
Each device’s IP, mask, gateway and VLAN
One traffic flow, such as a ping
- 02
Engine
Pure functions
ARP caches and switch MAC tables
VLAN domains and HSRP election
Longest-prefix routing
Returns A list of frames, each with the fields that changed since the hop before
- 03
Three.js stage
Devices and cables built in code
Packets as capsules on the floor
- 04
React interface
Capture table and step narrative
Byte diff and fixes
Keys Space plays or pauses, and the arrow keys step one frame
The whole app is one React component, 2,960 lines long. The engine sits at the top of the file and needs nothing from the other two parts.
A switch records the sender’s MAC against the port a frame came in on. It floods a frame whenever it has no single port to send it to, which covers broadcasts and any MAC it hasn’t learned yet. A router picks the route with the longest matching prefix, and every one of those rules reads the device’s current settings.
The math
The health score starts at 100 and loses points for each problem.
Health score
- health score100 minus the penalty of every open issue, never below 0
The header shows the score in green from 85 and in amber from 60. Anything lower is red.
| Item | Penalty |
|---|---|
| A gateway that no router owns | 30 |
| The only router is down | 30 |
| A router with no route to its own network | 25 |
| Two hosts on one IP | 20 |
| Plain HTTP on port 80 | 15 |
| A single router with no standby | 10 |
| Every host in one broadcast domain | 10 |
| A host that bypasses the HSRP virtual gateway | 8 |
| A router down while the standby carries traffic | 5 |
Routing rules
- same subnettwo addresses match once each is ANDed with the mask
- route chosenthe matching route with the longest prefix
- TTLstarts at 64 and drops by 1 at each router
- ARP timeout3 requests with no answer
Lab devices start on /24 masks.
What it found
The three labs that start broken score lowest before any fix.
The engine runs on its own in Node, with no browser and no 3D scene. The figures below come from running it that way against all seven labs.
Where it simplifies
The checksum on screen is a stand-in.
The Header checksum field shows a 16-bit slice of an FNV-1a hash over the source, destination, TTL and identification. It changes whenever TTL changes, which is the point lab 02 makes.
A real IPv4 checksum is a ones’ complement sum over the whole header, so the value here won’t match a real capture. The README says checksums are computed from live device config. That holds for the inputs, though the arithmetic is a hash.
What else is simplified
UDP checksums
Timing
TCP and TLS
A drop at a router
HSRP failover
Decisions
The whole lab ships as one component.
A pure engine
It takes a network and a flow and returns a list of frames. Editing a device runs it again, so the capture always matches the settings on screen.
Hardware built in code
Laptops, switches, the router and the servers are Three.js geometry. The app loads no model files.
One file
All three parts live in one component, with the engine at the top.
Pixel ratio capped at 2
The renderer never draws more than 2 device pixels for each CSS pixel.
Cleanup on exit
Leaving the stage cancels its animation frame and removes its listeners. Geometries, materials, textures and the renderer are all freed.
A note on small screens
Under 1,024 px wide, the app says it was built for a desktop screen and offers an Open anyway button.
Design
Each protocol keeps one color from the stage to the capture.
The interface is dark, with Inter for text and JetBrains Mono for labels and the capture table. Color carries the protocol.
Protocol colors
Eight of them. ARP is cyan, DNS is amber, TCP is blue, and a drop is always red. A packet on the stage and its row in the capture share the color.
Device accents
Each device type has its own accent, shown as the dot on its label.
Camera
A 28° camera looks down on the network like a diorama. Drag to orbit, right-drag to pan, scroll to zoom, and click a device to inspect it.
Playback
Four speeds from 0.5x to 4x, with a strip of ticks that marks every frame.
Where it stands
Live, with the code public and no tests yet.
- Guided labs
- 7
- Guided labs
- Devices in the base network
- 8
- Devices in the base network
- Issues the health score checks for
- 9
- Issues the health score checks for
- Automated tests
- 0
- Automated tests
What’s next
What I’d change where NetTracer stops short.
Next
Real checksums
Swap the hash for real ones’ complement checksums on IPv4 and UDP. A real IPv4 checksum still changes with TTL, so lab 02 keeps its point.
Tests and CI
Turn the per-lab figures on this page into the engine’s first tests, and run them on every pull request. The engine already runs without a browser.
A phone view
Put a still of a lab above the Open anyway button, or build a layout for small screens.
A check by hand
Walk the capture rows by keyboard, then play a capture with reduced motion turned on.
Known limits
Checksums
The IP and UDP checksums are hash stand-ins. They won’t match a real capture.
No tests
Nothing checks the engine yet, and the repo has no CI. One pull request has merged since the first build on November 5, 2026, and it added no tests.
Desktop only
There is no phone layout. A small screen gets the note and the Open anyway button.
Keyboard and motion
Capture rows now take keyboard focus, and Up, Down, Home and End move between frames. With reduced motion on, a new capture waits for Play and packets move only when you play or step. The pull request notes list both changes as not checked.
TL;DR
Built
A network lab in the browser where packets cross a 3D network one frame at a time.
Found
The three broken labs open with the lowest health scores, 35 to 45, and each delivers after its first fix.
By the numbers
- Guided labs
- 7
- Issues the health score checks for
- 9
- Automated tests
- 0
The catch
Nothing checks the engine yet. These scores come from running it in Node, with 0 automated tests behind them.
Next
Swap the hash stand-ins for real ones’ complement checksums on IPv4 and UDP.